A few weeks ago we introduced the benchmark data. You can compare yourself with others in the Equestic App. Based on your discipline, the height of your horse and your level.
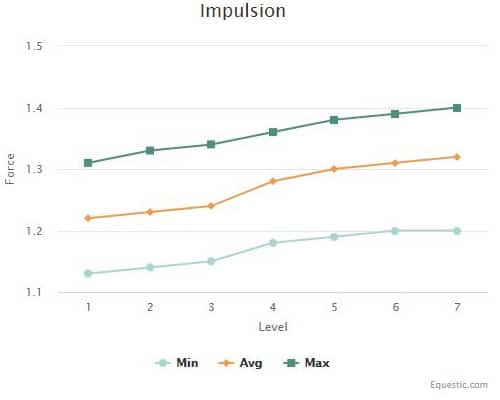
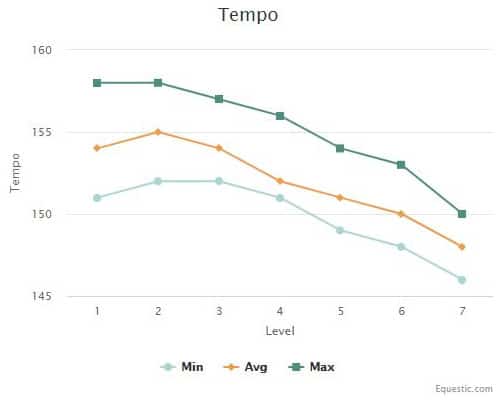
In the images below. you see Benchmark graphs for impulsion and tempo of a dressage horse with a height of 160cm-169cm (apprx 16hh to 17hh).
You see the minimum, average and maximum that has been measured for horses in that particular height class. On the horizontal axis you see the levels from 1 to 7.


The higher the education level of the horse and the more collection, the more the impulsion goes up. In this graph, compiled on the basis of all data of all riders with a SaddleClip, you can clearly see this trend.
You also see that when the impulsion goes up, the tempo goes down. This is also a result of collection, because the force that normally goes forward and causes a higher tempo, is now converted into an upward force = impulsion. This creates a longer moment of suspension and therefore a lower tempo.

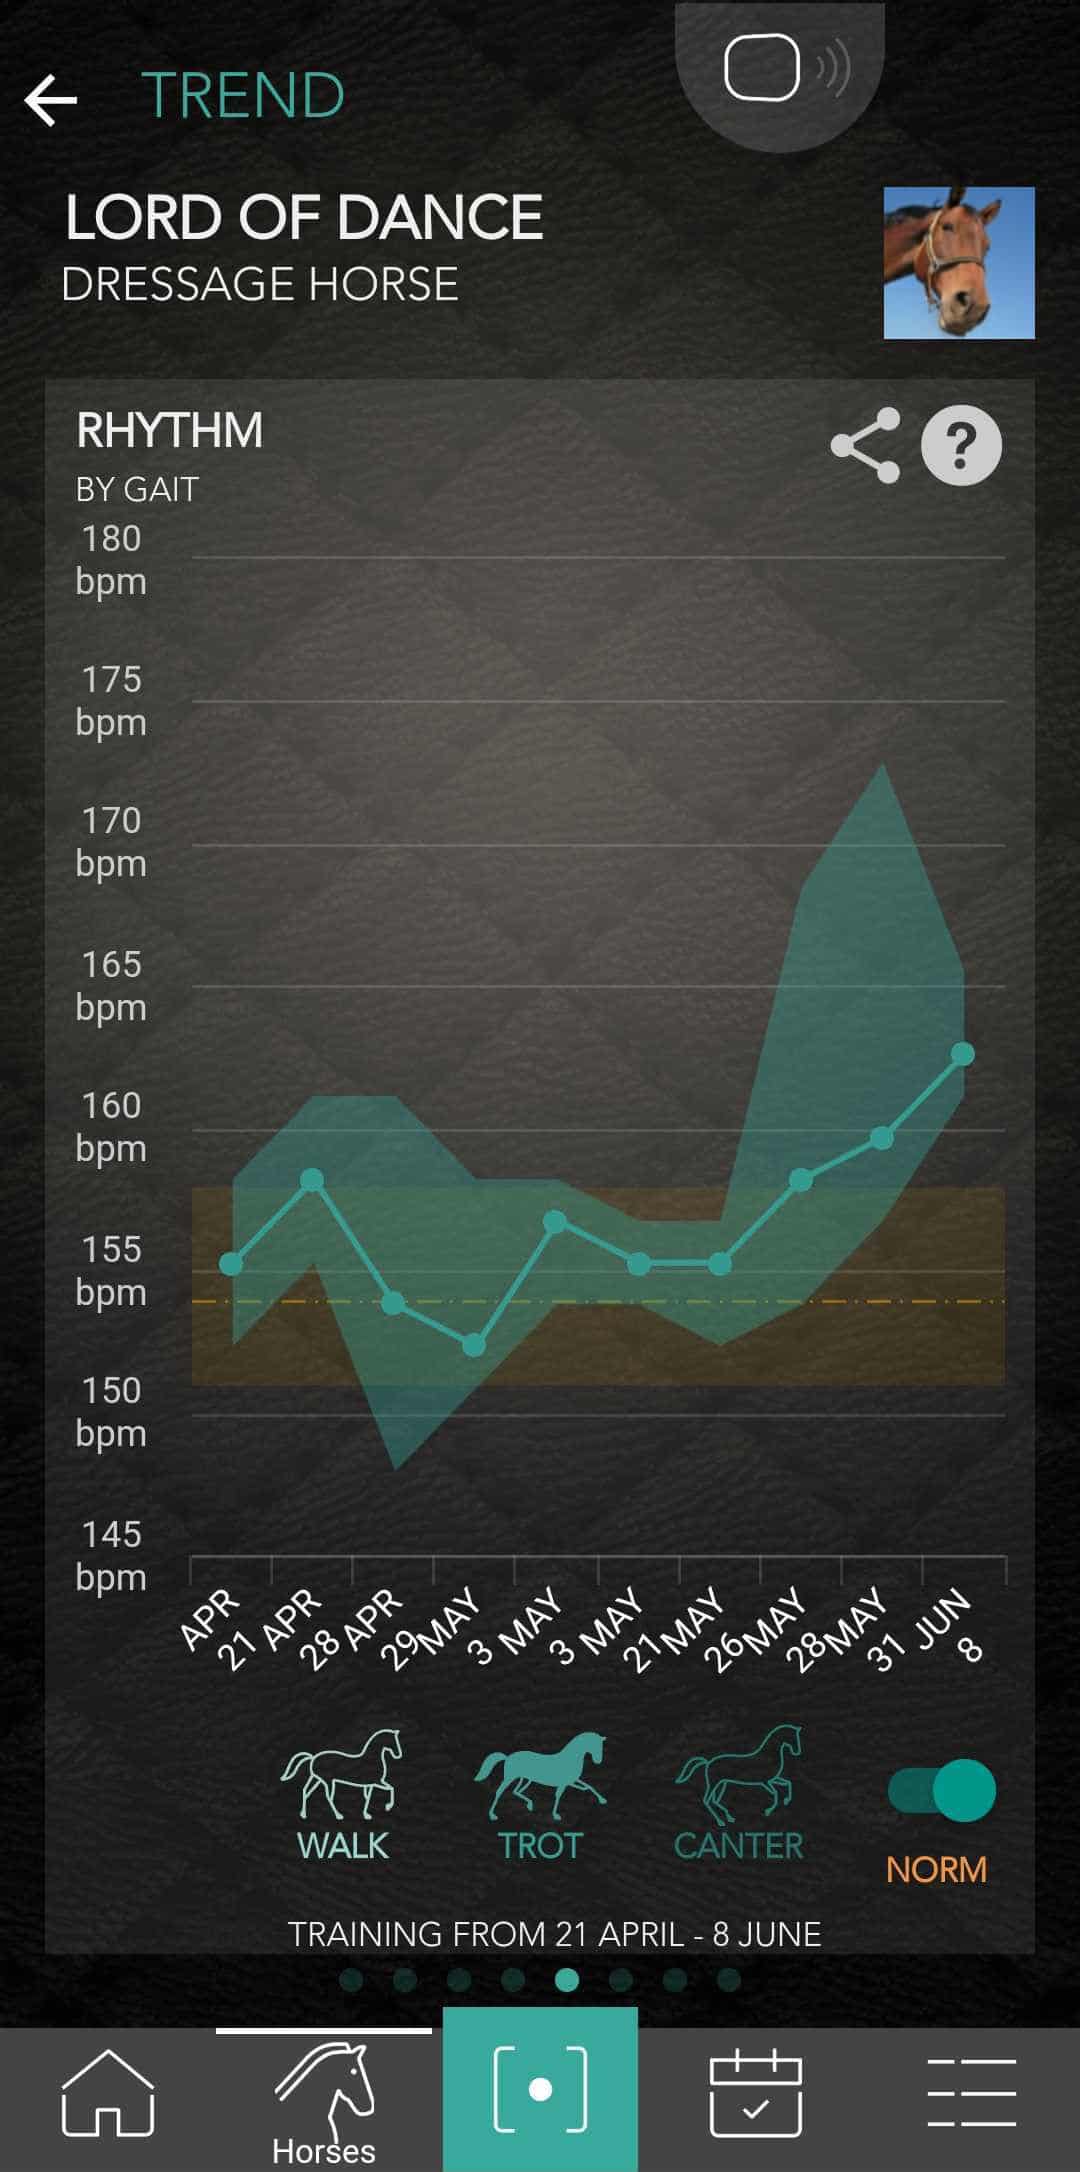
Here you can see how this looks in the app. The orange area is the average, the line and the dots represent your own measurements.
Would you like to view these overview charts yourself? Here you can fill in all options yourself and make a comparative graph.


